The MACD (Moving Average Convergence Divergence) indicator is a popular technical analysis tool used to identify trends, momentum, and potential buy/sell signals in financial markets. It helps traders understand whether an asset is gaining or losing strength.
What is MACD?
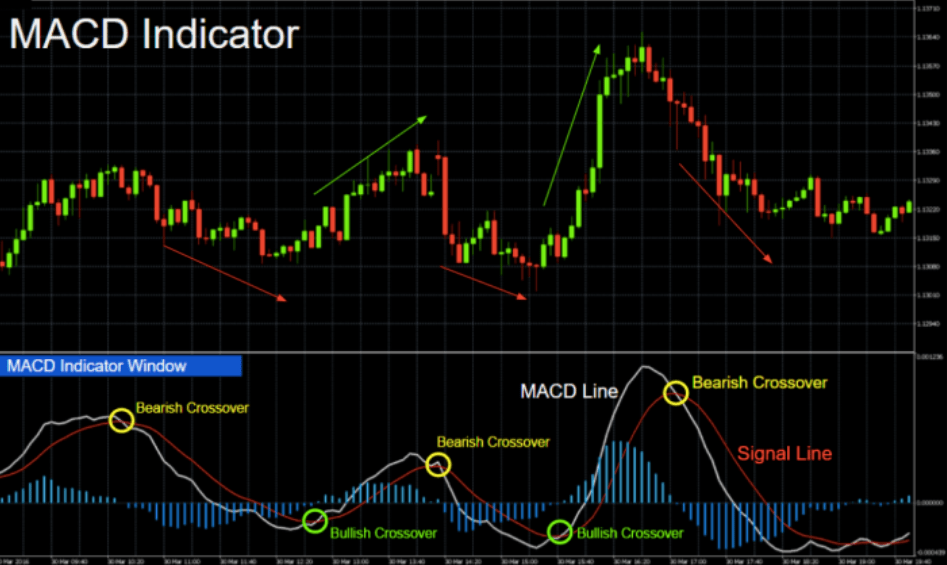
MACD consists of three main components:
- MACD Line: Calculated by subtracting the 26-period Exponential Moving Average (EMA) from the 12-period EMA.
- Signal Line: A 9-period EMA of the MACD line, used to generate trading signals.
- Histogram: Represents the difference between the MACD line and the Signal line, visually showing momentum changes.
How to Use MACD
Traders use MACD in several ways:
- Crossovers: When the MACD line crosses above the Signal line, it suggests a potential buying opportunity. When it crosses below, it may indicate a selling opportunity.
- Zero Line Crosses: If the MACD line moves above the zero line, it signals bullish momentum. If it moves below, it suggests bearish momentum.
- Divergences: If the price is making new highs while MACD is declining, it may indicate weakening momentum and a potential reversal.
MACD is widely used in stock, forex, and crypto trading to confirm trends and identify entry/exit points. You can find more details on how to interpret MACD here and here.

Deja un comentario